Investment Growth Calculator
See where consistent investing can take you
Enter your starting balance, monthly contribution, expected return, and time horizon to project future value — and understand how much comes from contributions versus growth.
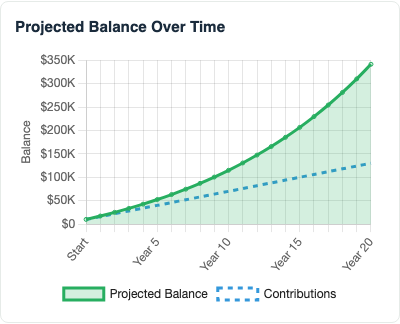
Projected Balance Over Time
Contributions vs. Growth
Final Breakdown
How This Calculator Works
We grow your balance using the compounding frequency you choose and add contributions at the start or end of each period. The chart shows projected balance by year; a second chart separates money you put in from investment growth.
Example
Starting with $10,000, investing $500/month at 8% average annual return for 20 years (annual compounding, end-of-month contributions) projects a portfolio of roughly $341,000 — with a large share from compounding.
FAQ
Is the expected return guaranteed?
No. Markets fluctuate. Use a long-term average assumption and treat results as estimates.
Should I use a pre-tax or after-tax return?
For taxable accounts, a lower after-tax assumption is often more realistic. Retirement accounts may grow tax-deferred.
Can I track this as a goal?
Yes. Click Track This Goal to save it locally in your browser and update progress later under My Goals.